The Enrollment Trending report provides you with a snapshot of your current enrollment count by Category. This report conveniently puts enrollment data all in one place, calculates % change over time, and graphs it for you.
The report is located under the Reports menu. Go to Reports > Find Reports > Classes/Enrollment (left menu) > Enrollment (tabs) > Enrollment Trending.
- Visually see your totals year over year.
- Review all your data in one report.
- Run the report for Active Enrollment (year over year) or Fall Enrollment (May - September).
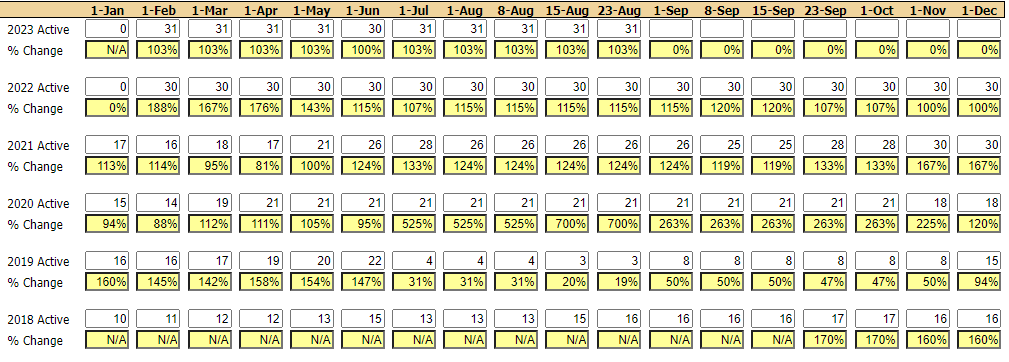
The numbers for the report can be edited in the data below each graph. Once saved, the numbers will not revert back to the original Jackrabbit calculated data. The data will have to be changed back manually.
Only Jackrabbit Users with the Telephone Listing User permission will be able to use this report.
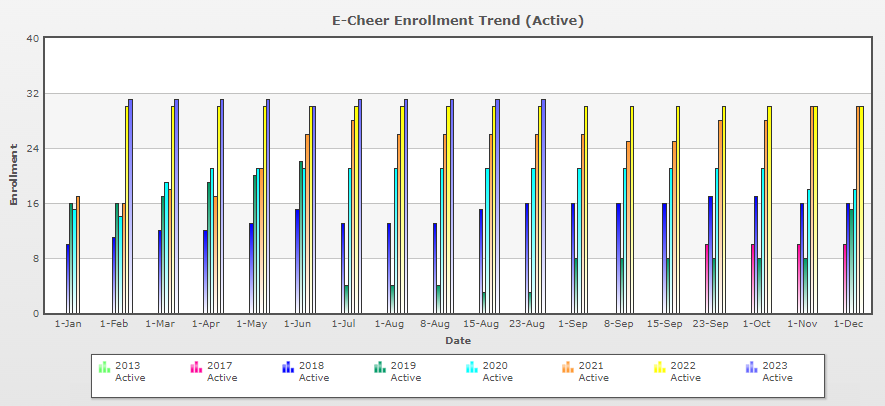
Sample Report Results
This report displays data from 2013 through 2023 by category.
Data can be modified by adding or changing enrollment numbers in the white boxes below the chart. Once saved, the numbers will not revert back to the original calculated data.
Save a frequently used report for quick and easy access! Click the Heart icon![]() next to a report name to change the heart to red
next to a report name to change the heart to red![]() and add the report to your Reports menu > My Reports.
and add the report to your Reports menu > My Reports.