Bar charts in the Revenue Summary widget display revenue information visually. The revenue amount on the charts is total revenue after discounts and refunds have been subtracted. It includes taxes.
- Gain quick insight into the financial health of your business.
- Make informed decisions based on historical revenue trends.
- Track the financial performance of your facility over time.
Permissions control your Users' ability to see certain data and take specific actions. The Revenue Summary widget requires the Dashboard-Revenue Summary permission in the General category. Learn more about User Permissions for the Executive Dashboard.
Widget Wisdom - Understand and Interact
The Revenue Summary widget offers two different views of your earnings over time, giving you options to analyze data in a way that suits you best. This flexibility makes decision-making easier and more personalized.
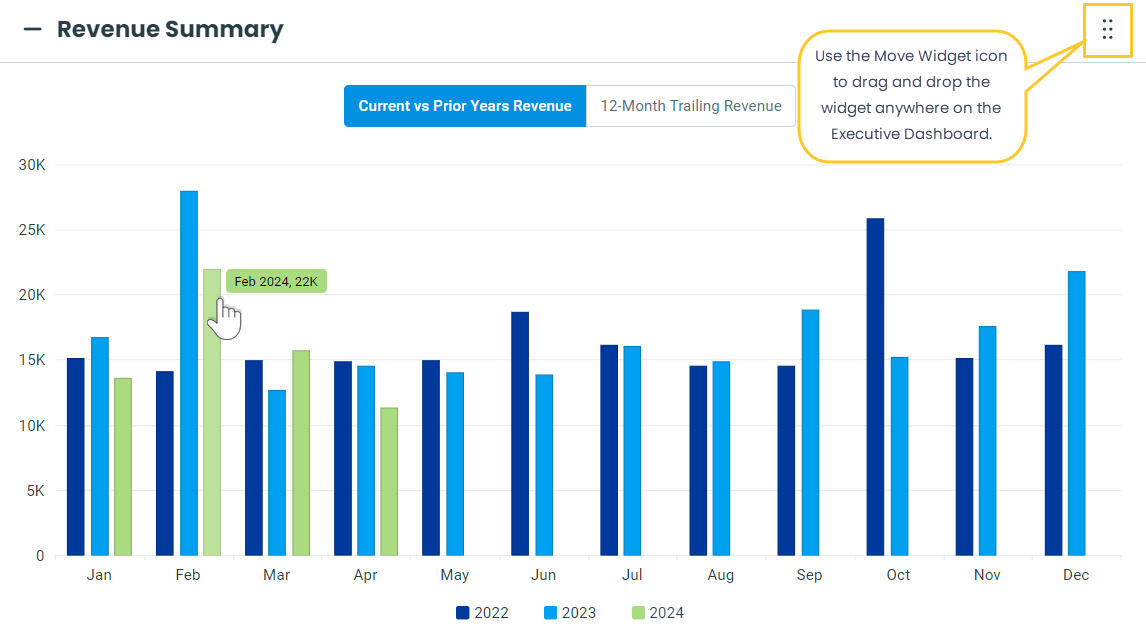
Current vs Prior Years Revenue
The Current vs Prior Years Revenue chart is a visual representation of your revenue for the current year and two previous calendar years. It is displayed by default.
- Hover over a bar to see the month, year, and dollar amount.
- Click any year at the bottom of the chart to hide that year's revenue data. Click on a hidden year to show it again.
12-Month Trailing Revenue
The 12-Month Trailing Revenue chart is a visual representation of your revenue over the past 12 months, updated regularly as each month passes.
- Select 12-Month Trailing Revenue to switch to that view.
- Hover over a bar in the chart to see the month, year, and dollar amount.
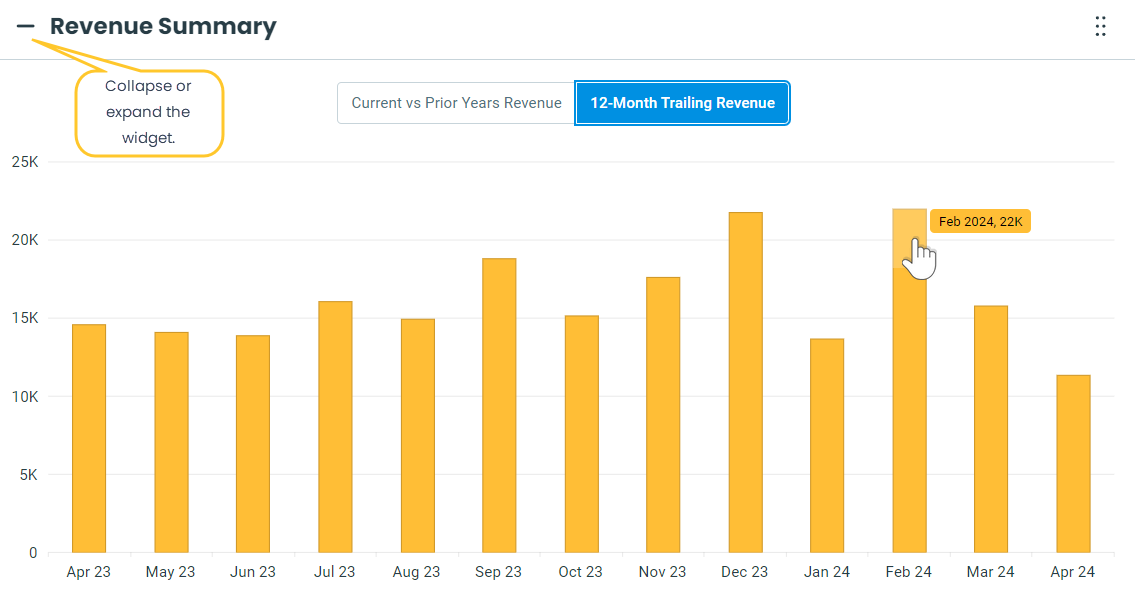
Use the Move Widget icon to drag and drop the widget anywhere on your Executive Dashboard to customize your view. Your chosen layout will be retained each time you visit. Collapse or expand the widget using the or
or  next to Revenue Summary.
 or
or  next to Revenue Summary.