Jackrabbit's Business Intelligence Dashboard (BID) sorts all of the valuable business data in your Jackrabbit system and streamlines it into one comprehensive dashboard using the powerful Microsoft Power BI platform.
- Eliminate the need to run multiple reports to get the whole picture.
- Gather data in one location to present your Key Performance Indicators (KPIs).
- Use your own valuable data to make business decisions for your organization.
The BID is included with all top-tier subscriptions. An Owner can request access for additional Users in the system by contacting Support. Depending on the permissions, each User may see different reports when they log in.
Access the BID Reports
To access the BID, log in to Jackrabbit with your User credentials. Go to Dashboards > Business Intelligence Dashboard.

Choose a category to access the corresponding section of reports.
| Category | Reports Available |
| Summary | Monthly Enrollment and Student Trending |
| Students | Overview of students by month/year, the Duration students attended classes, and Skills achievement for those students |
| Classes | First-of-the-month enrollments by month/year, including dropped classes, trial enrollments, and length of enrollment in class information. Additionally, all class information, how many classes are in your organization, openings in those classes, and the % of full classes. |
| Revenue | Trends by category, instructors, non-class revenue, and unapplied credits are part of this summary. |
The BID reports often consist of multiple pages, e.g., the Summary category contains two pages, Monthly and Yearly. Use the left menu to switch between the different pages.

 to open the Select an Option window and select another report category.
Interact With the BID Reports
There are many ways you can interact with the BID reports to control the data that is displayed. For example, hover over a visual to see relevant information or click on a specific data point to filter data.
Hover
Hovering over an element can trigger certain interactions and may display additional information. The specific behavior of hover may vary depending on the type of visual.
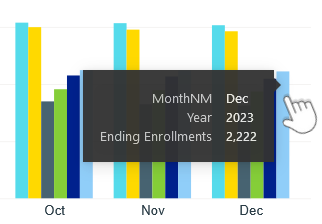
- Hover over an element in a visual to display a tooltip that provides additional details about that specific data point, such as the exact value, category, or other relevant information.
- Hover over a visual to view the icon panel. Some icons offer additional information about the data in the visual, whereas others offer additional options, e.g., exporting data. These icons vary between visuals. See Icons below for more information on each icon.


Filter
Data can be filtered in several ways.
| Top Filters | These high-level filters are located at the top of each page in the BID. They are applied to all visuals, graphs, and tables on the page.
 |
| Filter Pane | The filter pane houses the majority of the filters. Show or hide the filter pane using the double right arrow at the top right of the panel. Search for a specific filter using a keyword. These filters are applied to all visuals, graphs, and tables on the page.
 |
| Filter with an Element | Click on an element in a visual to filter the other visuals on the page by that element. Click it again to clear the filter.
 |
Icons
There are many different icons in BID reports; they are accessed by hovering over a visual (see the animated illustration in the Hover section above). The icons may differ between visuals.
| Icon | Function |
| Provides contextual help regarding the data in the visual, e.g., how the data was compiled. | |
| Displays any filters that have been applied to the visual. The filters can be cleared from the Filter Pane. | |
| Focus Mode allows you to zoom in on a specific visual or data point within a report for a closer and more detailed view. When you activate Focus Mode, the selected visual or data point expands to fill the entire screen, temporarily removing other report elements. | |
| More options for a visual are offered: export data, show data as a table, spotlight, insights, and sorting options (these options may vary between visuals). | |
| Click to turn on to drill down in the data table. | |
| Click to drill up in the data table. | |
| Go to the next level in the hierarchy. | |
| Expand all down one level in the hierarchy. |
Right-Click
Right-clicking in BID reports opens a menu that offers various actions and abilities depending on where you click and the type of object you are interacting with.
- When you right-click on a visual element (such as a chart or table), you may see options related to that specific visual. For example, you might have options to drill down into details, expand or collapse data hierarchies, or format the visual.
- Right-clicking on column headers in tables or charts can provide options for formatting. It may also offer filtering options to include or exclude specific values or the option to copy the visual.


Learn More About Each Report
You can use the links in the table below to learn more information about the reports included in the Business Intelligence Dashboard.
|
Summary |
Ending Enrollments Over Time, by Month: This is the total number of enrollments at the end of the month/year, as it compares to the previous months and previous years. Ending Students Over Time, by Month: This is the total number of students at the end of the month/year, as it compares to the previous months and previous years.
|
|
Students |
Overview: This report shows the ending Student counts month over month and the New Student Trend for students enrolling for the first time in your program. Duration: See the average age when students enroll in classes and the average age a student leaves. Skills: At a glance, Skill Achievement is shown in this report by skills and subskills.
|
|
Classes |
Enrollments: Monthly Enrollment trending, including Active Enrollment, Average Age at the time of Enrollment, Average Enrollment Dropped Age, and Average Months of Enrollment for all your classes. Classes: A view of the number of classes in your organization and the number of existing openings and % full. Multiple filters let you drill down to different locations, categories, instructors, date ranges, and more.
|
|
Revenue |
Summary: This data provides revenue insights at a glance by month/year. You will be able to determine which of the classes offered at your organization generate the most income.
|